Gravity Satellite Study Sharpens the Picture of Human Water Use
A longer observation record helps researchers examine where management and farming affect water storage.
Water measured through gravity
A NASA study described on October 20 uses GRACE and GRACE Follow-On measurements to examine changes in water stored on land. The analysis covers April 2002 to November 2025, connecting long-term gravity observations with patterns of water gain and loss.
A clearer local picture
Researchers identified 40 regions where storage trends were associated with human activities as well as climate variability. Groundwater irrigation, reservoirs and land-use changes were among the factors examined. Combining many satellite passes improved spatial detail, with a trade-off in time resolution.
Different places, different effects
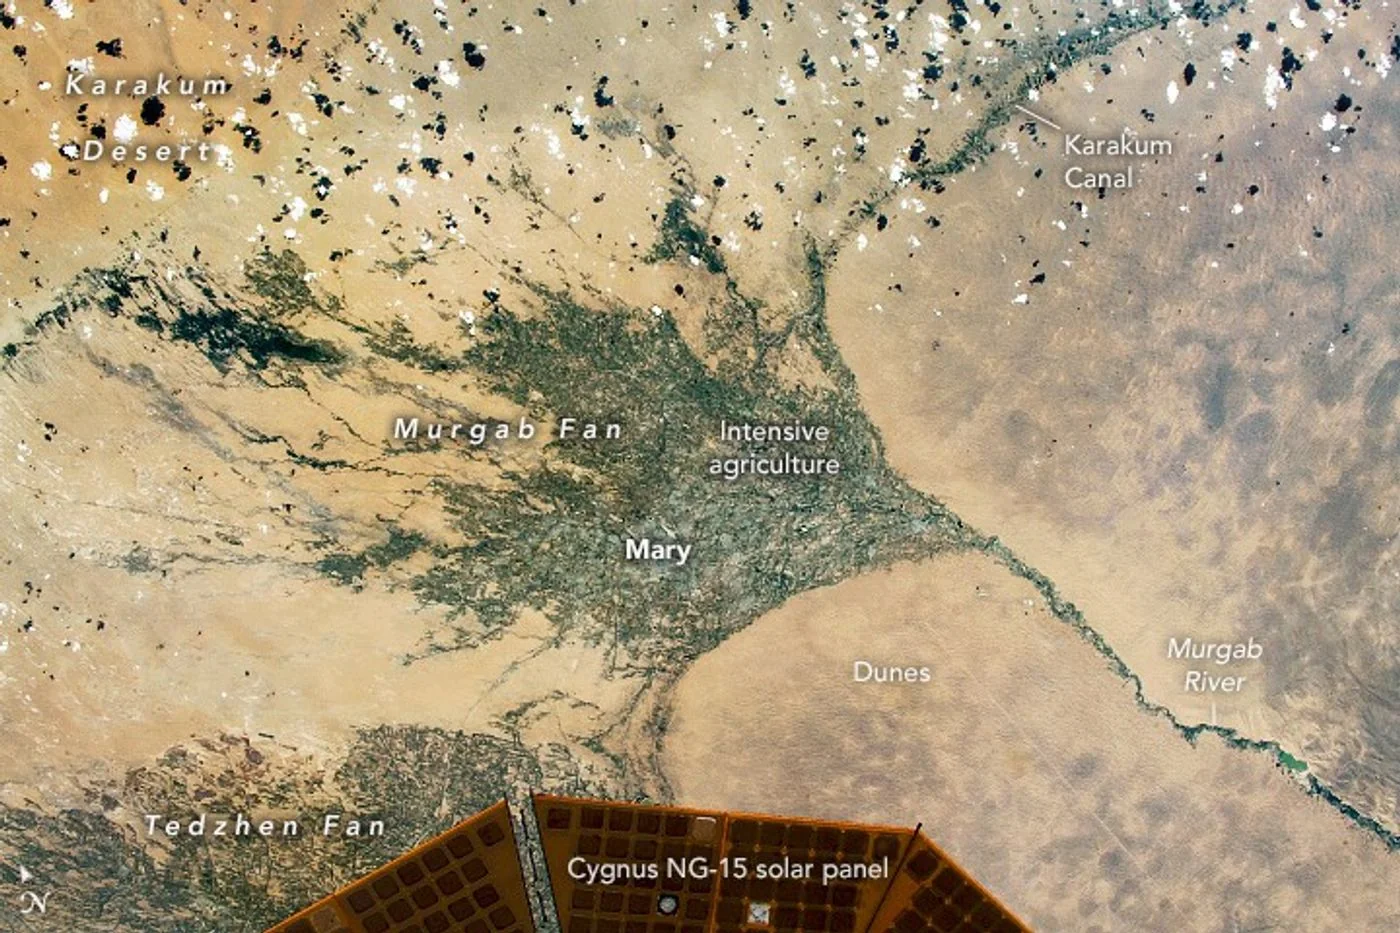
The findings include declines in heavily irrigated regions and gains associated with some reservoirs and diversions. The accompanying archive photograph shows the Karakum Canal, one example discussed in the report. It illustrates the setting, rather than directly showing an underground water trend.
Background and interpretation. The following sections add editorial explanation to the dated report. Hypothetical examples are illustrations, not newly reported events or interviews.
Why gravity can tell a water story
Water adds mass wherever it is stored. NASA's GRACE background explains that changes in the Earth's gravity field can therefore provide information about changes in stored water. This is a different way of observing the environment from photographing the surface. The satellites do not look through rock to take a picture of an aquifer. Their measurements support an analysis of changing mass over an area. Understanding that distinction makes the study more remarkable, while also preventing a misleading impression that the mission directly maps every underground pocket of water at a local scale.
Total storage is not the same as groundwater
NASA's explanation of terrestrial water storage includes several components, such as water at the surface, moisture in soil, snow and groundwater. The combined signal is therefore not automatically a direct measurement of one component. Separating those components requires other information and an appropriate method. This matters when a headline about water loss is interpreted as a statement about wells. A total-storage result may be highly informative, but the route from that result to a specific groundwater conclusion must remain visible. Otherwise a useful broad measurement can be assigned a more precise meaning than its analysis supports.
Changes need a reference point
A change in storage describes a difference relative to a reference, not necessarily the total amount of water available. The distinction is similar to knowing that an account balance changed without knowing its full balance. That analogy is only a reading aid, not a physical model of a basin. It helps explain why the baseline and time interval matter. A reported negative trend should be read with its units, geographic area and reference period attached. Without those details, a reader may confuse a rate of change, a cumulative difference and an estimate of total remaining water.
Spatial detail and time detail answer different questions
The source describes improved spatial information alongside a trade-off in time resolution. That kind of trade-off has a practical consequence for interpretation. A result designed to reveal a long-term regional pattern may not be suited to describing the response to one local rainfall event. A useful explanation states what the analysis resolves more clearly and what it averages or combines. More detail in one dimension does not mean unlimited detail in every dimension. Readers should therefore resist treating a sharper-looking regional result as a real-time measurement for an individual farm or town.
Why a trend does not identify its cause on its own
Stored water can change through more than one pathway. The original study examines human activities alongside climate variability, making attribution a separate analytical task rather than a label visible in the gravity signal. A strong account identifies the additional evidence used to connect a trend with a proposed explanation. It also allows for more than one influence. The phrase human fingerprint should not be simplified into a claim that every local change has a single cause, or that a satellite measurement alone determines the role of one particular user or policy.
A hypothetical basin comparison
Imagine two fictional basins showing the same total reduction over a chosen interval. In one, changes might be spread across several storage components; in the other, a different combination might dominate. The identical total would not establish identical conditions. This example explains why analysts combine evidence rather than assign a familiar cause from the headline number. It also shows the importance of selecting a comparison period. A short interval influenced by an unusual season and a long interval containing many seasons can answer different questions, even when they cover the same mapped area.
Connecting regional results with local records
A well measurement, a reservoir record and a regional satellite analysis describe water in different ways. They can complement one another without being interchangeable. An individual well may reflect local conditions that differ from a broad-area average, while the satellite record can reveal patterns beyond the reach of one monitoring point. The useful question is how the records relate in space and time. A disagreement is not automatically evidence that one instrument failed. It may indicate different coverage, different measured quantities or a need to examine how local observations are being generalized.
What the study means for public discussion
Water stories often move quickly from a scientific result to a debate about responsibility or future availability. Those are important subjects, but the transition should be explicit. A storage trend can inform a discussion without by itself deciding how water should be allocated or how a particular activity should be regulated. Policy choices also involve local information, objectives and trade-offs. This article separates the measurement explanation from those choices. It does not offer a water-supply forecast for a specific community or infer legal responsibility from a regional scientific pattern.
A checklist for reading the linked research
Before comparing the result with another report, identify the measured quantity, component coverage, reference period and geographic scale. Then ask whether a statement describes an observation, a statistical trend or an interpretation of cause. Finally, check whether later information revised the original finding. These are not interchangeable steps. They help a reader see how the study uses a long record of satellite measurements to investigate water storage while preserving the distinction between a broad signal and the detailed local questions that require additional evidence. That distinction is central to the value of the research, not an afterthought.
A rate and an accumulated change must not be mixed
A trend expressed per year and a total change over several years are different quantities. Readers should not compare their written numbers without accounting for time. Even then, a reported trend may summarize a variable record rather than describe an identical change in every year. This arithmetic distinction is valuable in water reporting because the language of loss can refer to several measures. Keeping units, area and duration together prevents an annualized figure from being mistaken for a total remaining supply. It also makes clear that a broad trend is not a timetable for the depletion of a particular local source.
An association in a regional analysis should not be read as a verdict on every farm or water project within it. Measurements, statistical methods and local records each contribute different evidence. Follow the linked study summary for the scope of its conclusions and remaining research questions.
Source & verification
This independently written summary is based on NASA’s original report, released 2026-10-20. Consult the source for research details, methods and subsequent updates. NASA does not sponsor or endorse this publication.
Further background: NASA: terrestrial water storage and GRACE.
 Astronaut Photograph Follows Utah’s Deeply Winding San Juan River
 Landsat View Reveals the Changing Shores of Southern Cyprus